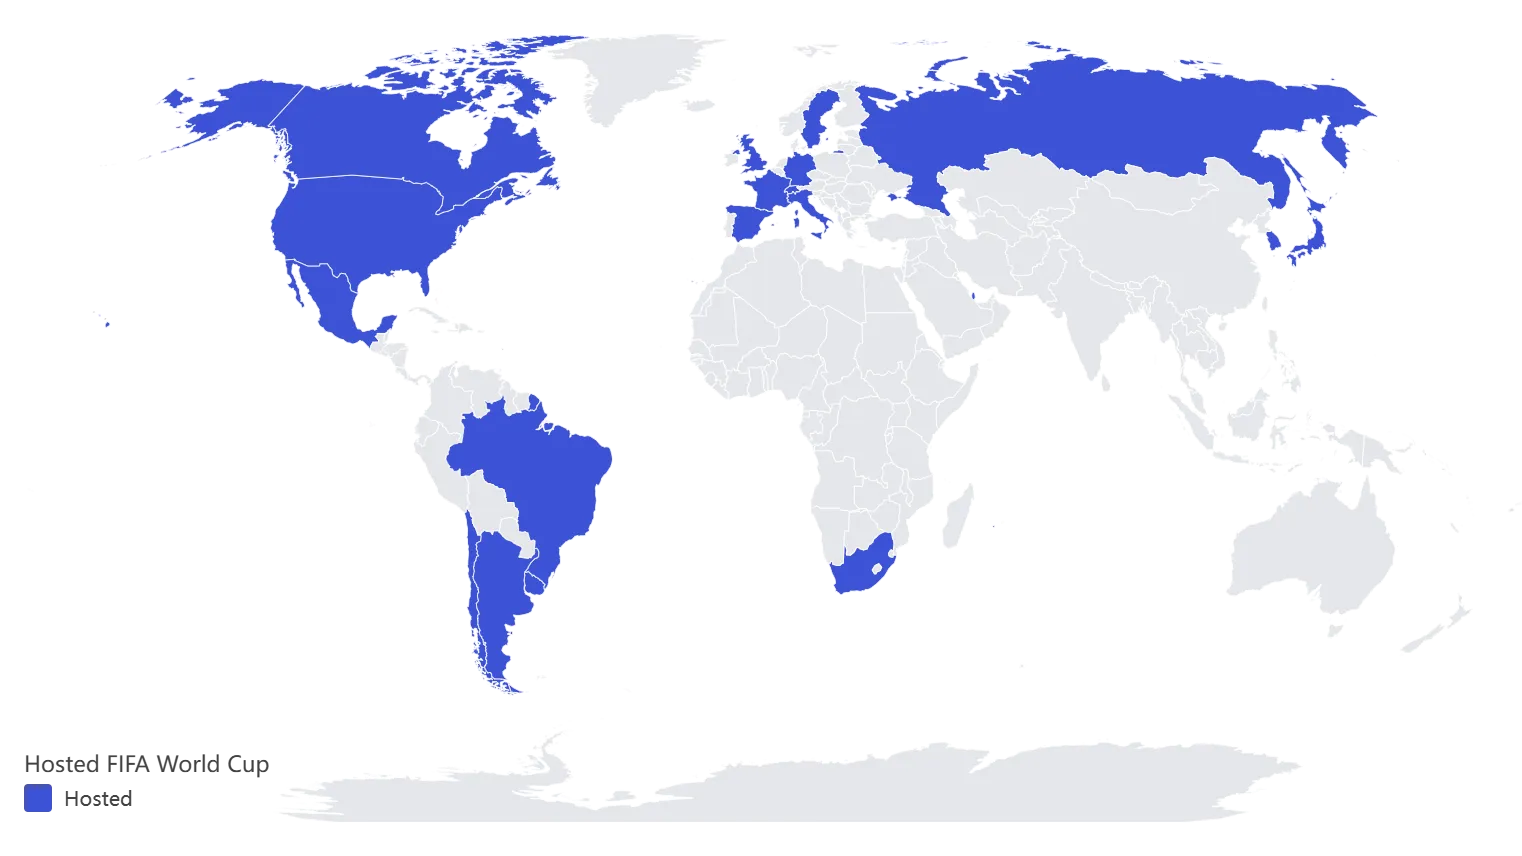
Host countries
19
Editions covered
23
FIFA World Cup Host Countries Map
A country-level view of every men's FIFA World Cup host from 1930 through the confirmed 2026 tournament, with 2026 treated as the latest milestone rather than the whole story.
MapHue intelligently understands your data, matches regions, recommends the right map style, and helps you make accurate, professional maps fast.
Tool capabilities
MapHue is built to understand your data, speed up first drafts, and help you move from imported values to professional map outputs with less setup work.
Start from the data you already have, or move faster with ready-to-use examples.
MapHue reads your data structure so you spend less time preparing files and more time making maps.
You do not need to decide everything from scratch. Start with a map style that fits the data.
From quick drafts to publishable assets, MapHue helps you move from data to usable map outputs fast.
How it works
The workflow is designed to stay simple: bring in your data, review the smart matching, choose the recommended expression, and publish the result.
Upload CSV or Excel files, paste table data directly, import from Google Sheets, or start from sample datasets.
Check the detected region and value columns, confirm country or region matches, and fix anything unclear quickly.
Start from the suggested map type, compare choropleth, binary, or segmented options, and lock in the clearest expression.
Export PNG or SVG, share with a link, or embed the map into articles, reports, or websites.
Use cases
Whether you are comparing regions, publishing data stories, or preparing presentation-ready visuals, MapHue is designed to help you move from data to map quickly.
Compare values across countries, states, provinces, or other mapped regions with a layout that is easy to read and quick to publish.
Turn datasets like GDP, internet use, unemployment, and population metrics into professional choropleths that work in reports and articles.
Build clear map visuals for explainers, data-led content, and newsroom publishing workflows without spending hours in GIS tools.
Create accurate map visuals for strategy decks, research summaries, and internal updates where speed and clarity both matter.
Start from reusable examples and sample datasets when you want to move from idea to publishable map even faster.
Featured examples
Explore current published topics to see how MapHue turns structured data into clear, professional map outputs.
Host countries
19
Editions covered
23
A country-level view of every men's FIFA World Cup host from 1930 through the confirmed 2026 tournament, with 2026 treated as the latest milestone rather than the whole story.
Country rows
184
90%+ countries
56
A 2024 country snapshot of internet use around the world, using one ITU reference year so countries are compared on the same basis.
Country rows
193
$50k+ countries
25
A 2025 country snapshot of nominal GDP per capita in current U.S. dollars, built from IMF DataMapper and normalized for world choropleth publishing.
Country rows
105
10%+ countries
17
A 2024 country snapshot of unemployment rates for adults aged 15+, using one ILOSTAT reference year for consistent comparison.
Data trust
MapHue is built to help you make maps quickly without losing confidence in the result. Source notes, geographic boundaries, and matching logic all support clearer, more verifiable outputs.
Boundary data from Natural Earth. Disputed boundaries shown as dashed lines and do not imply any political position.
Published examples pair each map with a matching data page, reference year, and source context.
Map outputs are grounded in stable geographic assets so comparisons stay consistent across topics.
MapHue helps surface unclear matches before publishing so you can review the result with confidence.
FAQ
MapHue can start from CSV files, Excel files, pasted table data, Google Sheets imports, and ready-to-use sample datasets.
Yes. Example datasets are part of the workflow so you can explore the tool faster, test map outputs, or use them as a starting point for your own work.
MapHue can recognize country and region references from names, map codes, ISO2, ISO3, and common naming variants, then surface unclear cases for review.
The current public focus is choropleth-style map making, including numeric choropleths, binary views, and segmented regional comparisons.
Yes. MapHue is designed to suggest an appropriate map expression based on the data, so you can get to a strong first draft quickly.
MapHue is designed to support publishable outputs including PNG, SVG, shareable map links, and embeddable map usage.
No. The workflow is meant to reduce manual setup so you can start from ordinary tabular data instead of specialist mapping software.
Yes. Insights pages show finished examples, while Data pages provide supporting datasets, source notes, and reusable starting points.
Because fast maps still need to be usable and explainable. Source-backed examples and clearer matching review help support more accurate, professional outputs.
Import your data, review smart matching, and create an accurate, professional map in seconds.